Some researchers employ techniques with their data that are reminiscent of those used by medieval inquisitors in an attempt to extract the results they (or their funders) seek. This practice has given rise to the well-worn maxim, “If you torture the data enough it will confess,” a phrase sadly as true as another similar adage: “Figures lie and liars figure.”
Unfortunately, once a study’s data are safely in the books, even if the research portion of the work was done honestly and with integrity, there are myriad statistical perversions that can be performed, such as downplaying a risk or magnifying a benefit.
There are a number of tools in the research torture chamber. Among these is axis stretching, demonstrated in the first graph below, where by dramatically spacing out the intervals on one of a graph’s axes, the research “reveals” a startling correlation that doesn’t really exist.
Another method is the use of relative risk reduction, often employed by Big Pharma to tout the benefit of a given drug. Case in point: The makers of the statin Lipitor trumpet a claim that it reduces cardiovascular disease risk by 36%, which sounds pretty impressive. But is it?
The company has made a lot of hay with that 36% claim, which is true-ish, but completely misleading. It’s a relative risk ratio—meaningless unless you know the actual absolute risk.
Here’s how this sleight of hand works: The 36% relative risk reduction figure for Lipitor (atorvastatin) came from a study published in Drugs titled, “Prevention of coronary and stroke events with atorvastatin in hypertensive patients who have average or lower-than-average cholesterol concentrations, in the Anglo-Scandinavian Cardiac Outcomes Trial–Lipid Lowering Arm (ASCOT-LLA): a multicentre randomised controlled trial.”
This study was a subset of a larger hypertension study in which about 20,000 subjects with high blood pressure and three other cardiovascular risk factors were randomized into two groups and given one of two blood pressure lowering medications. From this larger group, about half the subjects were found also to have elevated cholesterol levels. In addition to the blood pressure medications, half this high-cholesterol group received Lipitor (atorvastatin) while the other half got a placebo. In the Lipitor/placebo subset of the study, the endpoint was defined as a non-fatal heart attack or death from heart disease.
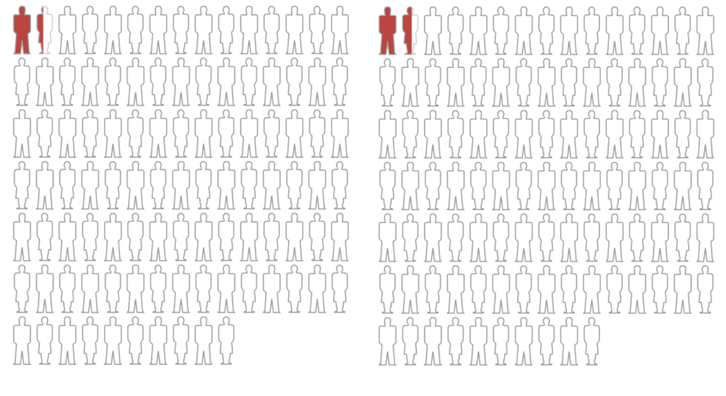
About 3.3 years into the study, the Lipitor/placebo arm was discontinued, owing ostensibly to a significant number of either heart attacks or deaths from heart disease in the placebo group. The researchers felt it was unethical to continue the study. (There was actually only a small difference in the ASCOT trial in cardiovascular disease (CVD) events or deaths between the two groups — a difference of only 48 out of a pool of 10,000 subjects, or a 0.4% difference. It is curious why the research team felt the need to intervene. One explanation could be the post-hoc picking of starting points and endpoints when the data look promising for statistical significance or appear to be trending away from significance. It’s a classic maneuver to sculpt study findings, but that’s a discussion for another day.)
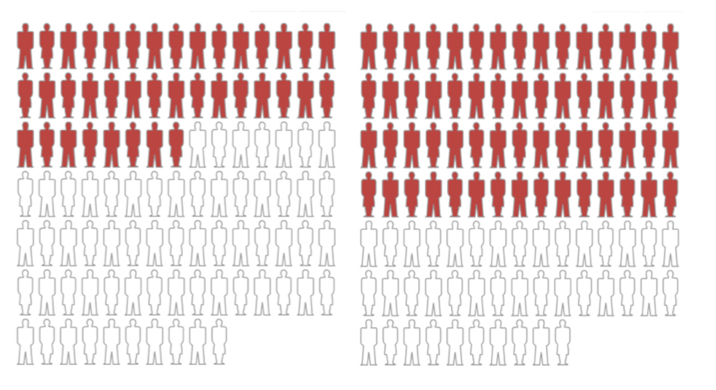
When the researchers crunched the abbreviated Lipitor data, it turned out that the group taking Lipitor experienced a 36% decrease in relative risk for heart disease compared to those on placebo. That robust finding led to a tsunami of Lipitor ads, as you’ve no doubt frequently seen.
Websites aimed at doctors featured info from the Lipitor package insert and graphics showing the relative risk reduction in campaigns designed to make any doctor concerned about saving his or her patients grab for the Lipitor pre-printed prescription pad.
Observe the graph below. It is 100% accurate, but, as we shall see, hugely misleading.
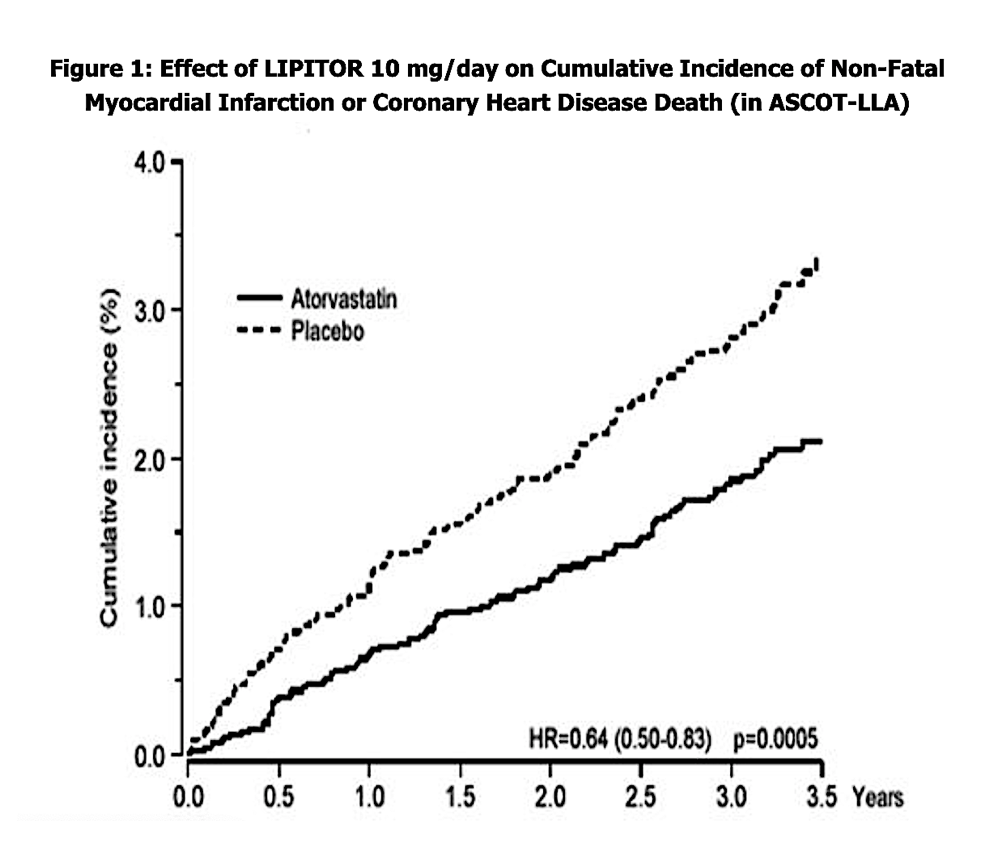
Figure 1: From “Prevention of coronary and stroke events with atorvastatin in hypertensive patients who have average or lower-than-average cholesterol concentrations, in the Anglo-Scandinavian Cardiac Outcomes Trial–Lipid Lowering Arm (ASCOT-LLA): a multicentre randomised controlled trial”