Some researchers employ techniques with their data that are reminiscent of those used by medieval inquisitors in an attempt to extract the results they (or their funders) seek. This practice has given rise to the well-worn maxim, “If you torture the data enough it will confess,” a phrase sadly as true as another similar adage: “Figures lie and liars figure.”
Unfortunately, once a study’s data are safely in the books, even if the research portion of the work was done honestly and with integrity, there are myriad statistical perversions that can be performed, such as downplaying a risk or magnifying a benefit.
There are a number of tools in the research torture chamber. Among these is axis stretching, demonstrated in the first graph below, where by dramatically spacing out the intervals on one of a graph’s axes, the research “reveals” a startling correlation that doesn’t really exist.
Another method is the use of relative risk reduction, often employed by Big Pharma to tout the benefit of a given drug. Case in point: The makers of the statin Lipitor trumpet a claim that it reduces cardiovascular disease risk by 36%, which sounds pretty impressive. But is it?
The company has made a lot of hay with that 36% claim, which is true-ish, but completely misleading. It’s a relative risk ratio—meaningless unless you know the actual absolute risk.
Here’s how this sleight of hand works: The 36% relative risk reduction figure for Lipitor (atorvastatin) came from a study published in Drugs titled, “Prevention of coronary and stroke events with atorvastatin in hypertensive patients who have average or lower-than-average cholesterol concentrations, in the Anglo-Scandinavian Cardiac Outcomes Trial–Lipid Lowering Arm (ASCOT-LLA): a multicentre randomised controlled trial.”
This study was a subset of a larger hypertension study in which about 20,000 subjects with high blood pressure and three other cardiovascular risk factors were randomized into two groups and given one of two blood pressure lowering medications. From this larger group, about half the subjects were found also to have elevated cholesterol levels. In addition to the blood pressure medications, half this high-cholesterol group received Lipitor (atorvastatin) while the other half got a placebo. In the Lipitor/placebo subset of the study, the endpoint was defined as a non-fatal heart attack or death from heart disease.
About 3.3 years into the study, the Lipitor/placebo arm was discontinued, owing ostensibly to a significant number of either heart attacks or deaths from heart disease in the placebo group. The researchers felt it was unethical to continue the study. (There was actually only a small difference in the ASCOT trial in cardiovascular disease (CVD) events or deaths between the two groups — a difference of only 48 out of a pool of 10,000 subjects, or a 0.4% difference. It is curious why the research team felt the need to intervene. One explanation could be the post-hoc picking of starting points and endpoints when the data look promising for statistical significance or appear to be trending away from significance. It’s a classic maneuver to sculpt study findings, but that’s a discussion for another day.)
When the researchers crunched the abbreviated Lipitor data, it turned out that the group taking Lipitor experienced a 36% decrease in relative risk for heart disease compared to those on placebo. That robust finding led to a tsunami of Lipitor ads, as you’ve no doubt frequently seen.
Websites aimed at doctors featured info from the Lipitor package insert and graphics showing the relative risk reduction in campaigns designed to make any doctor concerned about saving his or her patients grab for the Lipitor pre-printed prescription pad.
Observe the graph below. It is 100% accurate, but, as we shall see, hugely misleading.
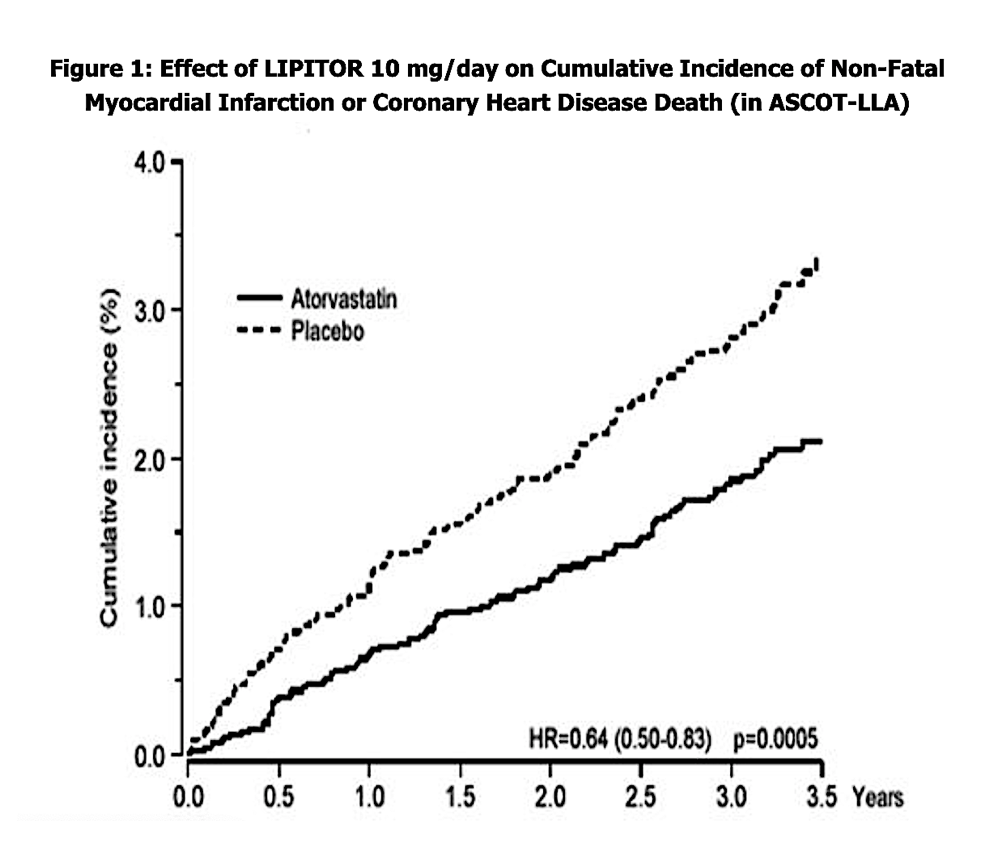
Figure 1: From “Prevention of coronary and stroke events with atorvastatin in hypertensive patients who have average or lower-than-average cholesterol concentrations, in the Anglo-Scandinavian Cardiac Outcomes Trial–Lipid Lowering Arm (ASCOT-LLA): a multicentre randomised controlled trial”
The widening gap between the Lipitor deaths and the placebo deaths looks ominous, but look at the y-axis (the percent incidence). This is an example of axis stretching to give a more pronounced visual effect. The choice to display incidence percent in 1% increments magnifies what would be two lines almost superimposed on a more reasonable scale.
But back to Lipitor’s 36% reduction. A reasonable person would want to know: What does that 36% really mean in terms of people saved or lost?
Here’s another way of showing it. The graphic depiction of 100 subjects below illustrates how that relative risk might look, with those who died while taking Lipitor on the left and those who died while taking placebo on the right.
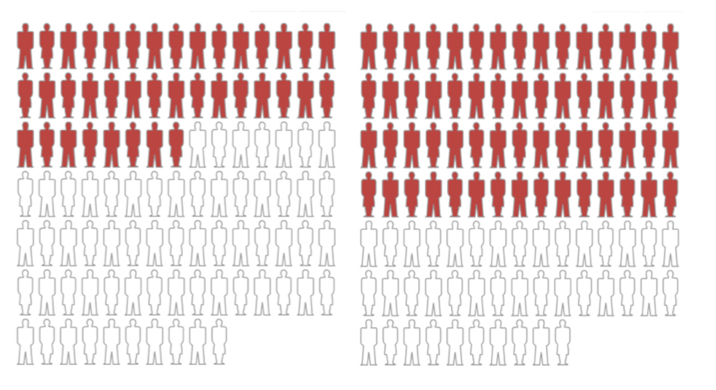
Figure 2
While impressive, Figure 2, which we created, shows a relative risk differential of 36% — but with a large absolute risk far exceeding the risk of CVD in the trial.
In Figure 3, you can see the actual absolute risk of experiencing a heart attack or dying from heart disease in this Lipitor study: a meager 1.1% reduction in absolute terms.
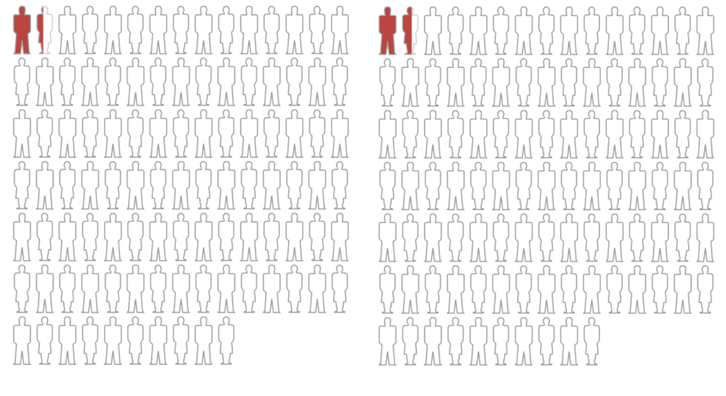
Figure 3
The 36% relative risk reduction is accurately shown here, too, but when depicted this way, would it send you stampeding to the pharmacy to pick up your Lipitor?
Doubtful.
Would you want to sign up to take a medicine that could give you muscle aches and pains, muscle wasting, short-term memory loss, and possibly even fatal liver or kidney damage based on the absolute risk shown above?
Probably not.
All of the above illustrates why you must always be on high alert when a study presents the benefit of a drug or vitamin or behavior as relative risk reduction. This is a warning sign of data racking. You always want to know the absolute risk before making a decision based on relative risk.
Because absolute risk tends to be low in drug studies, the pharmaceutical industry typically tortures the data, using the relative risk number to inflate the efficacy of their drug and make small (or even absent) benefits seem more substantial. Touting a 1.1% benefit for taking an expensive medication daily just doesn’t move the needle on sales.
On the other hand, the same research rackers use the flip side of the risk-ratio coin, employing absolute risk when it better suits them, such as when they’re endeavoring to minimize the side effects of taking said drug.
In the case of the Lipitor study, 5.2% of participants stopped using the drug because of adverse reactions or side effects (455 people out of 8,755 in that arm), while about 4% of people taking the placebo only stopped because of side effects (292 of the 7,311 who were in that arm). The manufacturer reported the results honestly as 5.2% and 4%, which seem like small numbers — just a 1.2% difference in side effects, after all, between the drug and a sugar pill. No big deal. Nothing to see here.
Were the researchers or manufacturer to have used relative risk to describe the side effects, as they did for the purported benefit, they’d have inflated that 1.2% difference by comparing it as a ratio: The difference between drug side effects of 5.2% and placebo side effects of 4.0% = 1.2% divided by the placebo rate of 4.0%, which turns that 1.2% difference into a whopping 30%. A third more people developed side effects severe enough to make them quit using the drug. But they’d never rack the data in that direction. Who would buy it then?
Additional Reading
- The Cardinal Sins of Skewed Research, Part 1: Cloaking
- The Cardinal Sins of Skewed Research, Part 3: Sweeping
- The Cardinal Sins of Skewed Research, Part 4: Bait and Switch
- The Cardinal Sins of Skewed Research, Part 5: Burning Britches

Drs. Michael and Mary Dan Eades are the authors of 14 books in the fields of health, nutrition, and exercise, including the bestseller Protein Power.
Dr. Michael Eades was born in Springfield, Missouri, and educated in Missouri, Michigan, and California. He received his undergraduate degree in engineering from California State Polytechnic University and his medical degree from the University of Arkansas. After completing his medical and post-graduate training, he and his wife, Mary Dan, founded Medi-Stat Medical Clinics, a chain of ambulatory out-patient family care clinics in central Arkansas. Since 1986, Dr. Michael Eades has been in the full-time practice of bariatric, nutritional, and metabolic medicine.
Dr. Mary Dan Eades was born in Hot Springs, Arkansas, and received her undergraduate degree in biology and chemistry from the University of Arkansas, graduating magna cum laude. After completing her medical degree at the University of Arkansas, she and her husband have been in private practice devoting their clinical time exclusively to bariatric and nutritional medicine, gaining first-hand experience treating over 6,000 people suffering from high blood pressure, diabetes, elevated cholesterol and triglycerides, and obesity with their nutritional regimen.
Together, the Eades give numerous lectures to the general public and various lay organizations on their methods of treatment. They have both been guest nutritional experts on over 150 radio and television shows, including national segments for FOX and CBS.
Comments on The Cardinal Sins of Skewed Research, Part 2: Racking
I never even though that you could choose to show a relative benefit v.s. a absolute for a drug study. I think that making it monitory to describe and interpret the data in absolute would make it easier to understand for the public (and even doctors who probably don't always have the time to go see the full study).
This is very important information, particularly if you haven't had a statistics course and are not familiar with the various presentations of data. Relative risk seems disingenuous for decision-making about whether to undergo a therapy or not, hence the moniker "racking" for stretching the truth.
Thank you very much for putting this out there. The final part about switching over the data on the rates of side effects made it immediately more clear as to why data racking is inherently unethical. The ultimate question I suppose is, which way should data be presented? Both sides, all sides, in a display where people can mess with the axis to see what they want to see? Or is it entirely up to the researcher to have enough scruples to know when he is fleecing the people with his/her statistics, or to know what a meaningful effect size actually is?
Jesse Ward~ If the data is presented in absolute numbers as absolute risk we'd think it more transparent and ethical, because there is no attempt on the part of the concluders to stretch for something that isn't really there. It would be fine to say something like 'the x more deaths in the treatment group represent a y% reduction of risk, but in absolute numbers the risk in either group is very small.' In the end, researchers ought to feel honor bound to the cause of science to present as honest a representation of what's been uncovered as is possible. At least in a perfect world.
The Cardinal Sins of Skewed Research, Part 2: Racking
4