Sir Edward A. Schäfer, Professor of Physiology at Edinburgh University, gave a series of lectures in California in 1913 in which he both named insulin and described its actions eight years before it was discovered by Frederick Banting and Charles Best. In his 1916 book based on these lectures, The Endocrine Organs, he wrote:
The results of pancreas extirpation … can be best explained by supposing that the islet tissue produces an autocoid which passes into the blood stream and affects carbohydrate metabolism and carbohydrate storage in such a manner that there is no undue accumulation of glucose in the blood. Provisionally, it will be convenient to refer to this hypothetical substance as insuline. (1)
Schäfer preferred the term “autocoid” to hormone because at the time, the terms autocoid and chalone described the action of drugs, with autocoid having an excitatory action and chalone an inhibitory one. His description of how he thought this hypothetical substance worked is astounding because medical history has proven him almost completely correct (He also predicted the existence of proinsulin — “pro-insuline” as he termed it — more than 50 years before it was actually discovered). And though he described “insuline” as having both an excitatory effect (autocoid) and an inhibitory effect (chalone), he presciently deemed the chalonic effect to be more important.
What Schäfer didn’t know — and what no one else at the time knew either — was that glucagon, the true autocoid, was also synthesized in the islets. Glucagon wasn’t identified until more than a year after insulin’s discovery and has since played second fiddle in the minds of most physicians and researchers to its vastly more famous counterregulatory hormone.
Insulin is considered to be the master regulatory hormone of metabolism. It drives excess glucose from the blood into the cells, inhibits the hepatic production and release of glucose, drives lipogenesis, and transports fat into the adipocytes and keeps it there. Insulin is the conductor of the metabolic symphony while glucagon has been seen to serve a secondary role. As it turns out, this hierarchy is not exactly the way it plays out in real life.
Insulin’s main function, as it turns out, is to regulate the output of glucagon, which is the more powerful of the two hormones. Studies in laboratory animals have demonstrated that when the insulin-producing beta cells are destroyed, the picture of Type 1 diabetes mellitus (T1DM) emerges: extreme hyperglycemia, polyuria, and ketosis, all driven by the unrestrained release of glucagon. But when the beta cells are killed off in animals in which the glucagon receptors have been knocked out, blood glucose remains normal despite the lack of insulin. This indicates that it’s not the deficiency of insulin that drives diabetes but the excess of glucagon instead (2).
Although Type 2 diabetes mellitus (T2DM) and T1DM have hyperglycemia in common, they are completely different disease processes. In T1DM, the beta cells have been destroyed by a virus or other toxic insult and can’t produce sufficient insulin to suppress the hyperglycemic effects of glucagon. T2DM patients typically have insulin resistance, as demonstrated by hyperglycemia in the face of plenty of insulin.
There is much controversy over the cause of T2DM. Among the etiologies postulated are genetic defects, insulin resistance, beta-cell exhaustion, glucotoxicity, obesity, and even redox reactions. Though any or all of these processes are plausible and may well play a causative role, there is another possibility seldom mentioned: lipotoxicity of the islets, driven by excess dietary carbohydrate consumption.
It is well known by physicians treating T2DM that even a modest weight loss often completely normalizes blood glucose levels in these patients — most, but not all. Almost all do respond, however, to a more substantial loss of body fat.
Adipose cells are a reservoir for energy storage. If humans had no fat cells, they would have to eat almost constantly, like hummingbirds, to fuel their ongoing metabolic processes. Thanks to adipose tissue stores throughout the body, humans can eat several times per day, or once a day, or even once every few days, and function nicely. It is estimated that there is enough stored fat in a typical normal-weight person (70 kg) to fuel a walk from Florida to New York, so going a bit without eating will not seriously compromise a human’s ability to maintain a routine. The energy storage capacity — the amount of adipose tissue available — varies by individual and is determined genetically. The problems associated with T2DM arise not necessarily because of the packing away of excess fat in the adipose tissue but because of exceeding the capacity of this limited adipose storage volume.
When all the normal fat depots are filled to capacity and incoming fat — comprising dietary fat and fat made from excess carbohydrate consumption — continues to require storage, there is a spillover effect. The fat stored in these locations that were never designed to store fat is called ectopic fat — i.e., fat where it isn’t supposed to be. Various organs throughout the body, but especially in the abdominal viscera, absorb this excess fat, a process not without consequences. First, the body treats this ectopic fat almost as if it is a foreign body and mobilizes the innate immune system to attack it. Macrophages are dispatched to the ectopic fat and, once there, release inflammatory cytokines and other attractants to recruit even more macrophages. The volume of this ectopic fat is often composed of 50 percent macrophages (3). Second, the ectopic fat can create disturbances within the various organs, compromising normal function.
Since the storage locations and volume of the normal adipose storage sites are doubtless determined genetically, this capacity is referred to as the personal fat threshold (PFT) (4). As long as subjects stay within their PFT, they should be spared the symptoms of T2DM, irrespective of how obese they may be, because they have little, if any, problematic ectopic fat. If, however, even relatively thin subjects exceed their PFT, they can develop impaired glucose tolerance, insulin resistance, and even T2DM. We can see this demonstrated in animal models of obesity and diabetes.
For the first eight weeks or so of their lives, diabetes-prone (db/db) mice maintain about the same amount of body fat as lean (+/+), wild-type mice. As can be seen from the graphic below, just before the eight-week mark, the pancreatic islet fat content of the db/db mice begins to rise compared to that of the +/+ mice. As the islet fat increases, T2DM develops in the db/db mice (5). As the increased fat accumulates in the islets, the morphology of the beta cells changes markedly (6, 7). During the first eight weeks, the beta cells in the db/db mice have normal-appearing mitochondria and plenty of insulin granules. After 10 weeks, many of the beta-cell mitochondria appear severely damaged, and the insulin in the beta cells has degranulated (8).
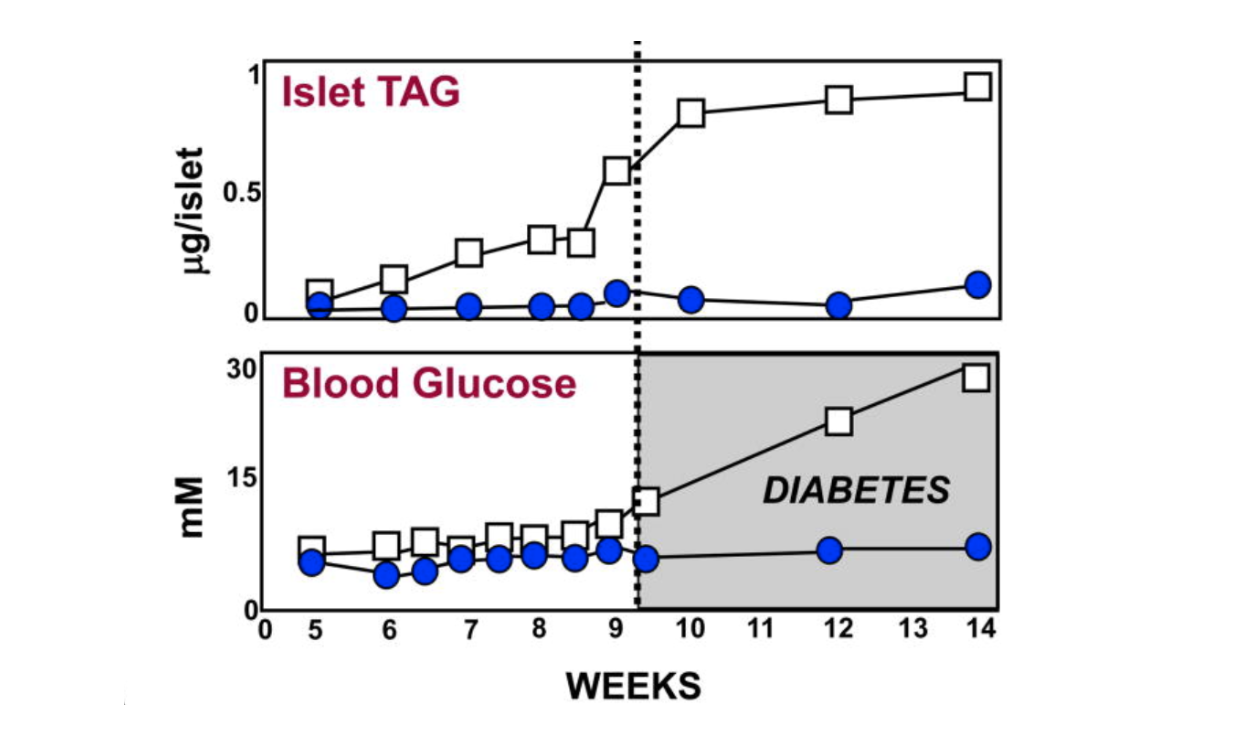
Figure 1: Pancreatic islet fat content in diabetes-prone (db/db) and lean, wild-type (+/+) mice
But does this happen in humans as well? The graphic below shows it does. Ildiko Lingvay et al. used magnetic resonance spectroscopy to determine the pancreatic fat content in human subjects and compare it to their degree of glucose intolerance. Normal-weight, glucose-tolerant subjects were compared to obese, glucose-tolerant and obese, glucose-intolerant subjects. As is apparent, there was a substantive increase in pancreatic fat when moving from the obese, glucose-tolerant situation to obese glucose intolerance (9). Even subjects with fully developed T2DM have little more, if any more, pancreatic fat than those with just glucose intolerance.
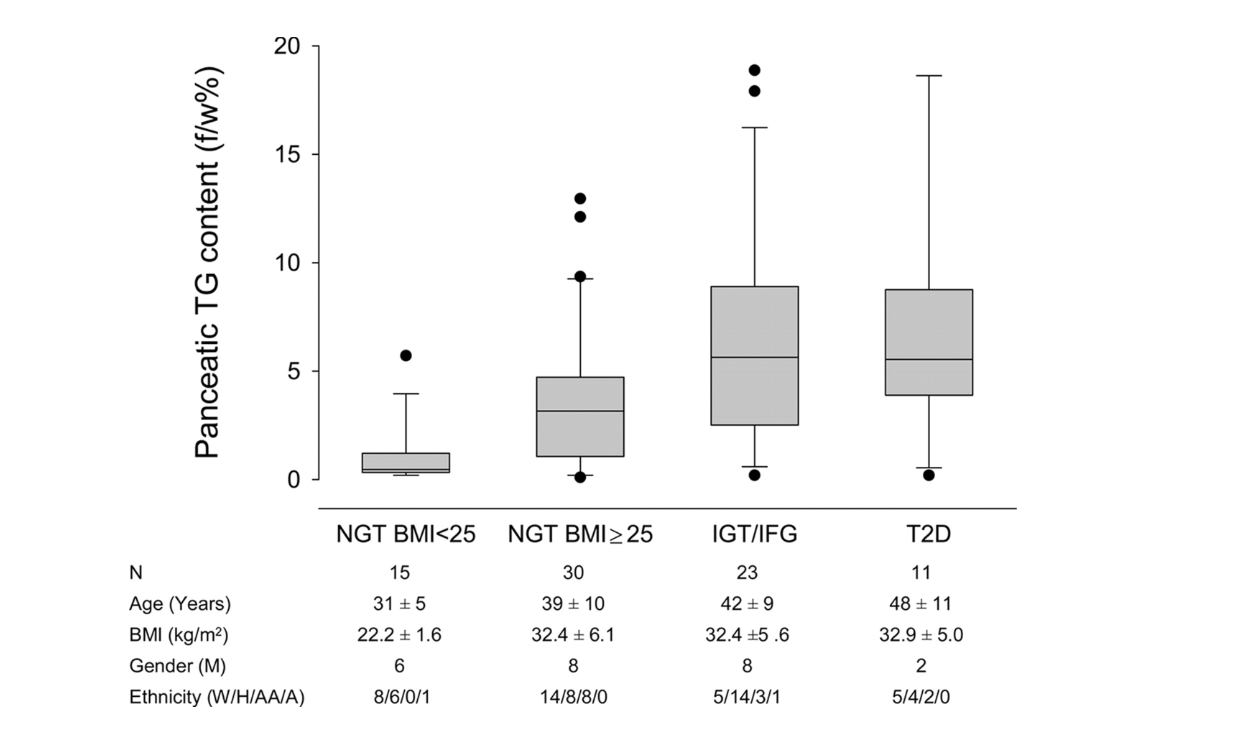
Figure 2: Pancreatic fat content in normal-weight, glucose-tolerant subjects; obese, glucose-tolerant subjects; obese, glucose-intolerant subjects; and subjects with Type 2 diabetes
It is axiomatic that correlation does not mean causation, so these findings cannot prove with certainty that increased fat accumulation in the pancreas is the cause of T2DM. There is other evidence, however, to strengthen the hypothesis.
The graphic below shows the normal paracrine response to an increase in glucose perfusion in normal non-diabetic animals. As the glucose perfusion in the animals triples from 5 mM to 15, it is accompanied by a sharp spike in insulin release that quickly tapers off. The spike lasts but a couple of minutes and represents only about 10% of the total insulin release. This rapid spike hitting the alpha cells markedly reduces the secretion of glucagon. The important thing to note is that it is the spike in insulin that immediately lowers the glucagon, while the lower insulin level following the spike is able to maintain the lower glucagon level.
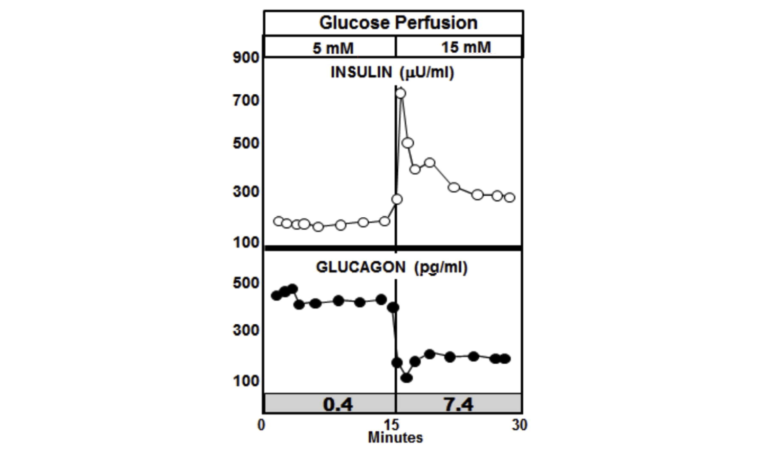
Figure 3: Paracrine response to an increase in glucose perfusion in normal non-diabetic animals
Now consider what happens when the glucose perfusion is tripled in the pancreases of diabetic rats. In the graphic below, the most notable feature is the absence of the insulin spike and lack of suppression of glucagon. In fact, insulin levels increase in the diabetic animals to a higher level than they do in the non-diabetic animals, but glucagon is not suppressed and continues to rise (10).
The insulin-to-glucagon ratio at the point of the spike in the non-diabetic animals is about 7.4, whereas the ratio in the diabetic animals is below circa 0.4.
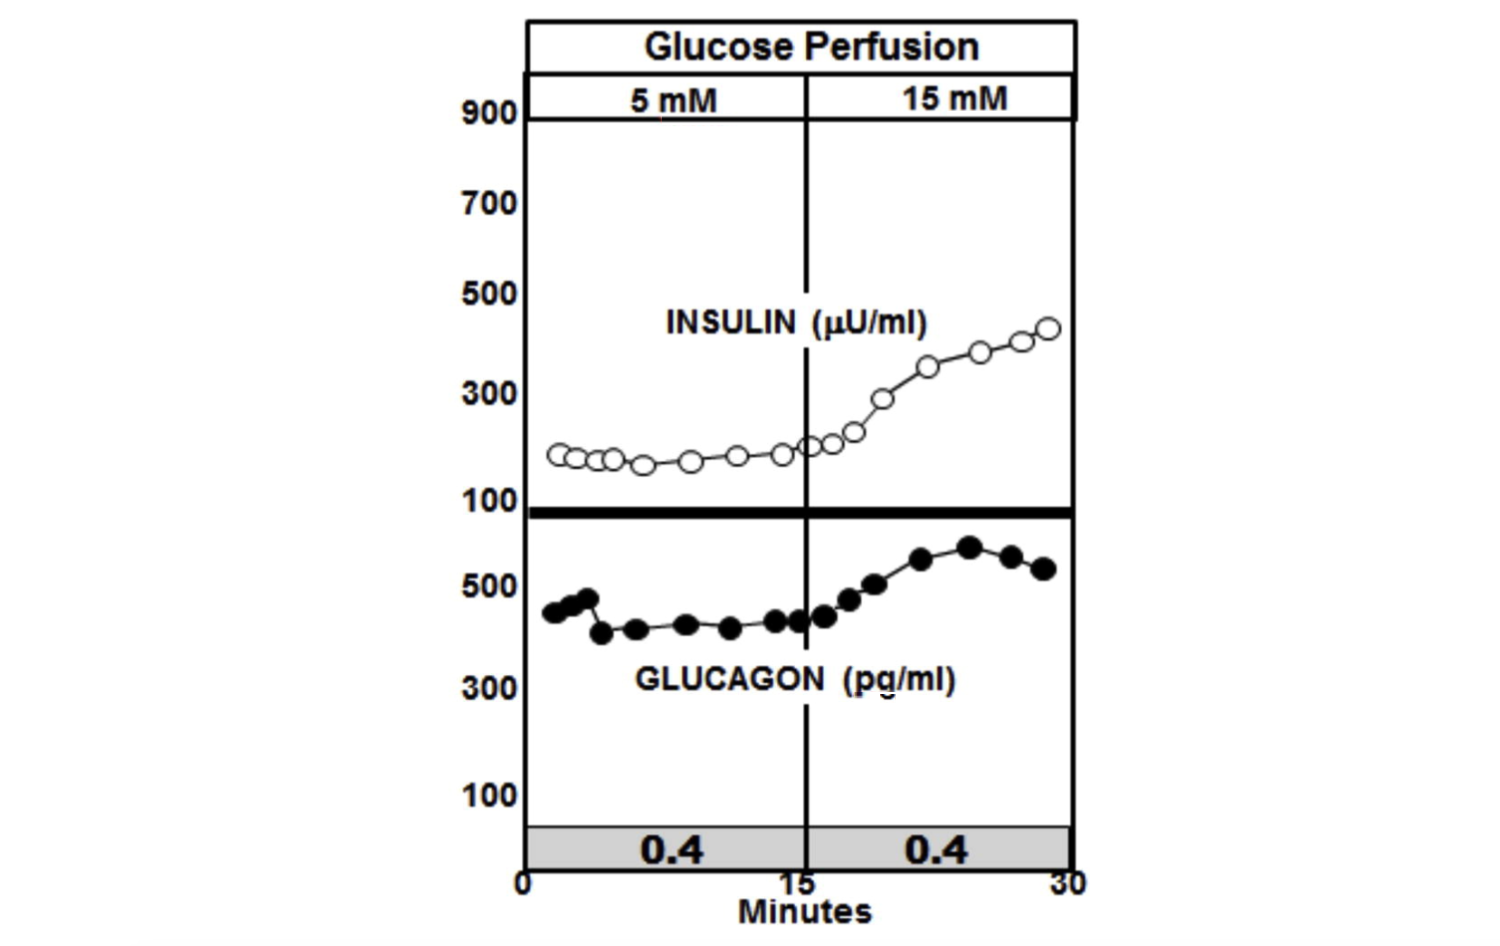
Figure 4: Glucose perfusion in diabetic rats
An insulin-to-glucagon ratio of 7.4 signals to the liver that there is an abundance of glucose in the blood and the liver needs to start extracting it and converting it to glycogen. A ratio of 0.4 sends the opposite signal. It tells the liver that the animal, despite having elevated glucose levels, is running low and the liver had better start making more glucose and releasing it. All of this leads to chronically elevated glucose levels in T2DM patients.
But why is the insulin response blunted in those with T2DM? Research has shown that both the insulin-producing beta cells and the alpha cells, which secrete glucagon, are compromised when ectopic fat invades the islets where these cells reside. Along with the ectopic fat, ceramide, a sphingolipid, further impedes the function of these cells.
The ectopic fat spills into various organs, including the pancreas, when PFT is exceeded. Under the influence of serine palmitoyl transferase, palmitate (the saturated fat made by the liver during de novo lipogenesis) combines with serine to form ceramide, which has been thought to be a driving force behind insulin resistance for years (11). Serine palmitoyl transferase, the rate-limiting enzyme in ceramide synthesis, is expressed in higher levels in diabetes-prone db/db mice. Compared to +/+, wild-type mice, labeled ceramide shows up in much greater amounts in the plasma of db/db mice. Experiments in which cultured alpha cells are exposed to insulin alone or insulin plus ceramide generate markedly different production levels of glucagon mRNA. In the chart below, it can be seen that without the inhibitory influence of insulin (and without ceramide), the alpha cells produce a given amount of glucagon. When insulin is added, as expected, the amount of glucagon mRNA drops markedly. But when the same amount of insulin is added along with ceramide, the amount of glucagon mRNA produced by the alpha cells skyrockets. Clearly, ceramide in the islets can trigger insulin resistance. The impairment of the beta cells due to ectopic fat infiltration (lipotoxicity), which leads to reduced insulin output, combined with alpha-cell insulin resistance creates the perfect storm for T2DM (12).
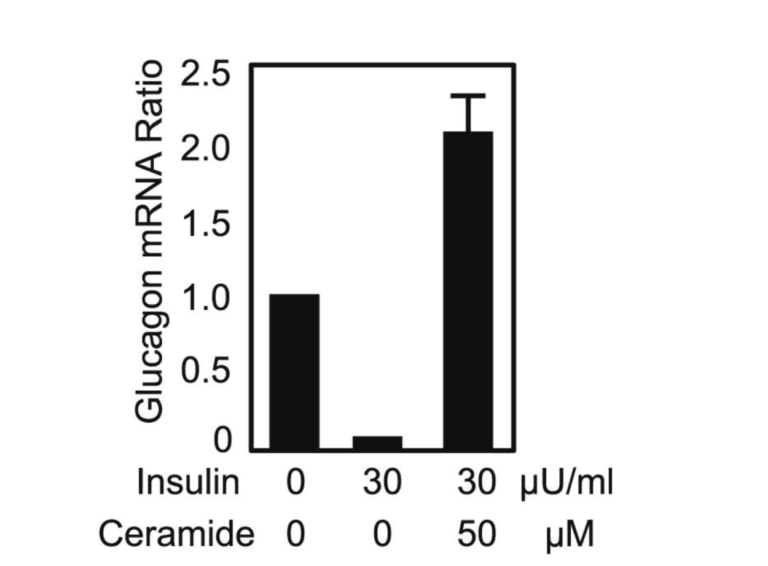
Figure 5: Glucagon mRNA ratio in cultured alpha cells when insulin and ceramide are introduced.
Normal individuals have metabolic flexibility, which means they can easily process whatever food is presented to them without experiencing any metabolic perturbations. If they eat carbohydrates, they burn carbohydrates. If they eat fat, they burn fat. If they eat both, they burn the carbs first and store the fat to burn later. If they eat a lot of carbohydrates, they burn what they need and store the rest as glycogen. If they eat more carbohydrate than they can burn immediately and their glycogen stores are filled, their livers, via de novo lipogenesis, convert the excess carbohydrate to palmitate, a saturated fat, which is then stored in adipose tissue, a vastly larger reservoir for stored energy than glycogen. In metabolically flexible people, this process works without a hitch. But this is not the case in those prone to obesity, T2DM, and other metabolic disorders.
As discussed above, when individuals reach their PFT and start spilling excess fat into places it shouldn’t go, the trouble begins. Some people who are genetically endowed with vast fat storage depots may become obese while staying healthy. Because of their genetics, they can continue to store excess fat in places where it is designed to be stored, and apart from being obese, they suffer few of the consequences of those who aren’t so genetically wired.
People who have much less “safe” storage space for excess fat may end up exceeding their PFT without becoming obese. Then they begin to store fat ectopically in their visceral area and organs. Most people fall in between these two extremes. They become moderately obese, exceed their PFT, generate ectopic fat, and end up with insulin resistance, hyperinsulinemia, impaired glucose tolerance, and ultimately, T2DM.
The rapid, almost epidemic rise in both obesity and T2DM over the past several decades raises the question as to cause. Why are people so much fatter than they were in the 1970s, and why is there so much more T2DM now than then? The answers to these questions are mired in controversy. Some experts say we’ve been eating too much fat. Others say we’ve been eating too many carbohydrates. Others yet say we’ve just been eating too much, irrespective of macronutrient composition. What’s the answer?
Without going into the seemingly never-ending debates that have been ongoing since the obesity/ T2DM epidemic began, a different tack would be to look at the outcome of the volume of studies done in the last 20 years. An organization in the United Kingdom called the Public Health Collaboration (PHC) has tabulated all the studies comparing low-fat diets versus low-carbohydrate diets and compared the outcomes for both weight loss and diabetes control as measured by HbA1c change.
Since the early 2000s, the PHC has gathered 62 studies comparing the effectiveness for weight loss of low-carbohydrate diets and low-fat diets. Of these 62 studies, in terms of overall weight loss, low-carbohydrate diets have bested low-fat diets 53 times. Low-fat diets have generated more weight loss than low-carbohydrate diets seven times. In two studies, the weight loss was equal. But in looking at statistically significant weight loss, 31 of the 62 studies showed the low-carbohydrate diet to be superior. In none of the 62 studies did the low-fat diet show a statistically significant weight loss compared to the low-carbohydrate diet. These studies are tabulated on the PHC’s website.
In looking at studies comparing how effectively low-fat diets and low-carbohydrate diets reduce HbA1c, the story is the same. Fifteen studies were tabulated looking at the two diets. In 13 of the 15 studies, low-carbohydrate diets were better than low-fat diets in lowering HbA1c. The low-fat diet was more potent in two studies. In terms of statistically significant reduction of HbA1c, it was a shutout for the low-carbohydrate diet. Eight of the 15 studies showed a statistically significant reduction of HbA1c with the low-carbohydrate diet, whereas there were no statistically significant reductions with the low-fat diet. The results are available here.
The only conclusion that can be reasonably drawn from the results of these studies is that removal of carbohydrates from the diet results in more weight loss and greater reduction of HbA1c. Logically, the obverse would seem to be that too much carbohydrate in the diet creates the problem.
Looking at historical trends since the obesity and T2DM epidemics began shows that since the late 1970s, Americans have increased their per capita consumption of calories by almost 250 per day. And although fat and protein have increased slightly, the vast majority of this increase has come from carbohydrate calories. After remaining relatively stable for decades, both obesity and T2DM rates surged after this increase in carbohydrate calories.
Carbohydrate consumption increases blood glucose. The increased glucose signals to the beta cells to release insulin, which tamps down the release of glucagon from the alpha cells. The insulin-to-glucose ratio goes up, which sends the message to the liver to start storing calories: Start converting glucose to glycogen and storing it away, and start driving fat into the fat cells. Between meals or during fasting (while sleeping, for example), insulin levels fall and the glucose-to-insulin ratio drops, sending the opposite signal to the liver: Start releasing fat from the fat cells, breaking down glycogen, and releasing glucose. The reduced insulin washing over the alpha cells allows them to produce more glucagon to assist in generating glucose and releasing fat. Once mealtime comes around, glucose goes up, insulin goes up, and the storage process starts again.
But if too much carbohydrate is taken in for too long, things begin to go awry. If enough fat is stored away under the influence of insulin, driven by excess carbohydrate consumption to exceed the PFT, any new fat is stored as ectopic fat. The excess carbohydrate fills the glycogen stores, and the rest is converted to palmitate via de novo lipogenesis (13). The ectopic fat damages the beta cells, as described above, and the palmitate in susceptible individuals is driven by serine palmitoyl transferase to condense with serine and convert to ceramide. The ceramide accumulating in the islets makes the alpha cells resistant to the insulin coming from the beta cells, which have themselves been damaged by ectopic fat. The insulin-to-glucagon ratio falls, sending the signal to the liver to start increasing the production of glucose, even though there is already plenty of glucose in the blood. This increase in blood glucose drives the damaged beta cells to produce even more insulin, which is relatively ineffective in suppressing glucagon output from the insulin-resistant alpha cells. Ultimately, whole-body insulin resistance ensues. And paradoxically, although the elevated insulin levels are progressively less and less effective in controlling blood sugar, their effectiveness in storing fat runs unabated, making the problem of ectopic fat leakage even worse (14). This, in turn, results in more insulin, more glucagon release, and a worsening of the problem.
A number of drugs have been developed to treat T2DM. These pharmaceuticals have varying degrees of effectiveness in reducing blood glucose but don’t have much effect in treating the overall disease. Restricting carbohydrates is the most effective treatment to reverse the above-described cascade. But since the majority of patients don’t want a lifestyle change, drugs have become a mainstay of T2DM treatment. Some physicians operating under the assumption that a lack of insulin is the real problem treat T2DM with insulin, which, despite lowering the blood glucose, can make the underlying problem more severe.
As with T1DM, the real problem is an overproduction of glucagon. Glucagon receptor knockout mice (GcgR-/-) don’t develop obesity or T2DM.
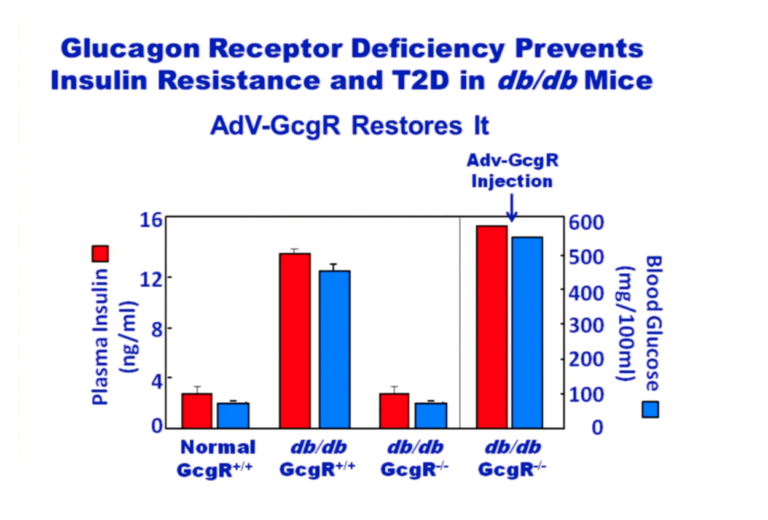
Figure 6: Plasma insulin and blood glucose levels in normal and glucagon receptor knockout mice (GcgR-/-), with and without injection of glucagon receptors via adenovirus
From the above graphic, it is apparent that normal mice on a chow diet maintain normal blood glucose and insulin levels. Over time, db/db mice that have active glucagon receptors have hugely elevated glucose and insulin levels whereas db/db mice without glucagon receptors have glucose and insulin levels equivalent to normal mice. But if these GcgR-/-, db/db mice are provided glucagon receptors attached to an adenovirus, their glucose and insulin levels skyrocket. The lack of glucagon receptors prevents the insulin resistance common to db/db mice. Adding glucagon receptors back in causes insulin resistance. From these experiments, it’s clear that the problem is caused by the glucagon. Adding insulin simply makes the problem even worse, which has been confirmed by a recent study in humans (15).
At this point, the single most effective treatment for T2DM is carbohydrate restriction (16). It is the first strategy that should be deployed to treat these patients. Unfortunately, it is a treatment that is all too rarely used.

Drs. Michael and Mary Dan Eades are the authors of 14 books in the fields of health, nutrition, and exercise, including the bestseller Protein Power.
Dr. Michael Eades was born in Springfield, Missouri, and educated in Missouri, Michigan, and California. He received his undergraduate degree in engineering from California State Polytechnic University and his medical degree from the University of Arkansas. After completing his medical and post-graduate training, he and his wife, Mary Dan, founded Medi-Stat Medical Clinics, a chain of ambulatory out-patient family care clinics in central Arkansas. Since 1986, Dr. Michael Eades has been in the full-time practice of bariatric, nutritional, and metabolic medicine. He and his wife have been in private practice devoting their clinical time exclusively to bariatric and nutritional medicine, gaining first-hand experience treating over 6,000 people suffering from high blood pressure, diabetes, elevated cholesterol and triglycerides, and obesity with their nutritional regimen.
Together, the Eades give numerous lectures to the general public and various lay organizations on their methods of treatment. They have both been guest nutritional experts on over 150 radio and television shows, including national segments for FOX and CBS.
References
- Sharpey-Schäfer EA. The Endocrine Organs: An introduction to the study of internal secretion. London: Longmans, Green, 1916.
- Lee Y, Berglund ED, Wang MY, Fu X, Yu X, Charron MJ, Burgess SC, Unger RH. Metabolic manifestations of insulin deficiency do not occur without glucagon action. Proc Natl Acad Sci USA. 109.37(2012): 14972-6.
- Boutens L, Stienstra R. Adipose tissue macrophages: going off track during obesity. Diabetologia. 59.5(2016): 879-94.
- Taylor R, Holman RR. Normal weight individuals who develop type 2 diabetes: the personal fat threshold. Clin Sci (Lond). 128.7(2015): 405-10.
- Unger RH, Scherer PE. Gluttony, sloth and the metabolic syndrome: a roadmap to lipotoxicity. Trends Endocrinol Metab. 21.6(2010): 345-52.
- Unger RH. Lipotoxic diseases. Annu Rev Med. 53(2002): 319-36.
- Unger RH. Minireview: weapons of lean body mass destruction: the role of ectopic lipids in the metabolic syndrome. Endocrinology. 144.12(2003): 5159-65.
- Shimabukuro M, Zhou YT, Levi M, Unger RH. Fatty acid-induced beta cell apoptosis: a link between obesity and diabetes. Proc Natl Acad Sci USA. 95.5(1998): 2498-502.
- Lingvay I, Esser V, Legendre JL, Price AL, Wertz KM, Adams-Huet B, Zhang S, Unger RH, Szczepaniak LS. Noninvasive quantification of pancreatic fat in humans. J Clin Endocrinol Metab. 94.10(2009): 4070-6.
- Unger RH, Roth MG. A new biology of diabetes revealed by leptin. Cell Metab. 21.1(2015): 15-20.
- Chavez JA, Summers SA. A ceramide-centric view of insulin resistance. Cell Metab. 15.5(2012): 585-94.
- Lee Y, Berglund ED, Yu X, Wang MY, Evans MR, Scherer PE, Holland WL, Charron MJ, Roth MG, Unger RH. Hyperglycemia in rodent models of type 2 diabetes requires insulin-resistant alpha cells. Proc Natl Acad Sci USA. 111.36(2014): 13217-22.
- Schwarz JM, Neese RA, Turner S, Dare D, Hellerstein MK. Short-term alterations in carbohydrate energy intake in humans. Striking effects on hepatic glucose production, de novo lipogenesis, lipolysis, and whole-body fuel selection. J Clin Invest. 96.6(1995): 2735-43.
- Brown MS, Goldstein JL. Selective versus total insulin resistance: a pathogenic paradox. Cell Metab. 7.2(2008): 95-6.
- Mendez CE, Walker RJ, Eiler CR, Mishriky BM, Egede LE. Insulin therapy in patients with type 2 diabetes and high insulin resistance is associated with increased risk of complications and mortality. Postgrad Med. 1-7(2019).
- Feinman RD, Pogozelski WK, Astrup A, Bernstein RK, Fine EJ, Westman EC, Accurso A, Frassetto L, Gower BA, McFarlane SI, et al. Dietary carbohydrate restriction as the first approach in diabetes management: critical review and evidence base. Nutrition. 31.1(2015): 1-13.