Ancel Keys launched his landmark Seven Countries Study (1) in 1958, pioneering both the use of huge population studies to establish relationships between food and health and an influential understanding of the nature of a healthy diet that has been with us ever since. The Seven Countries Study was essential in forming the belief that consuming saturated fat increases blood cholesterol, leading in turn to atherosclerosis and heart disease. It was one of the largest and most ambitious scientific projects undertaken at the time, and Keys quickly became a well-known public authority on heart disease.
Certain critical issues, however, have always undermined the study’s core conclusions. They are manifest in Keys’ thinking and have been institutionalized in nutritional epidemiology research ever since. To understand these issues, it helps to look at Keys’ earliest work on this “diet-heart hypothesis” and how it evolved.
Keys formulated his diet-heart hypothesis based on research he carried out personally in Greece, Italy, Spain, South Africa, Japan, and Finland. This led to a 1953 publication laying out his thinking and supporting his conclusions with what he would later call a “remarkable relationship” between fat consumption and heart-disease fatality visible even in easily available national statistics. While Keys’ 1953 argument and the supporting evidence were simplistic, the problems with its logic are still characteristic of much of nutrition science today.
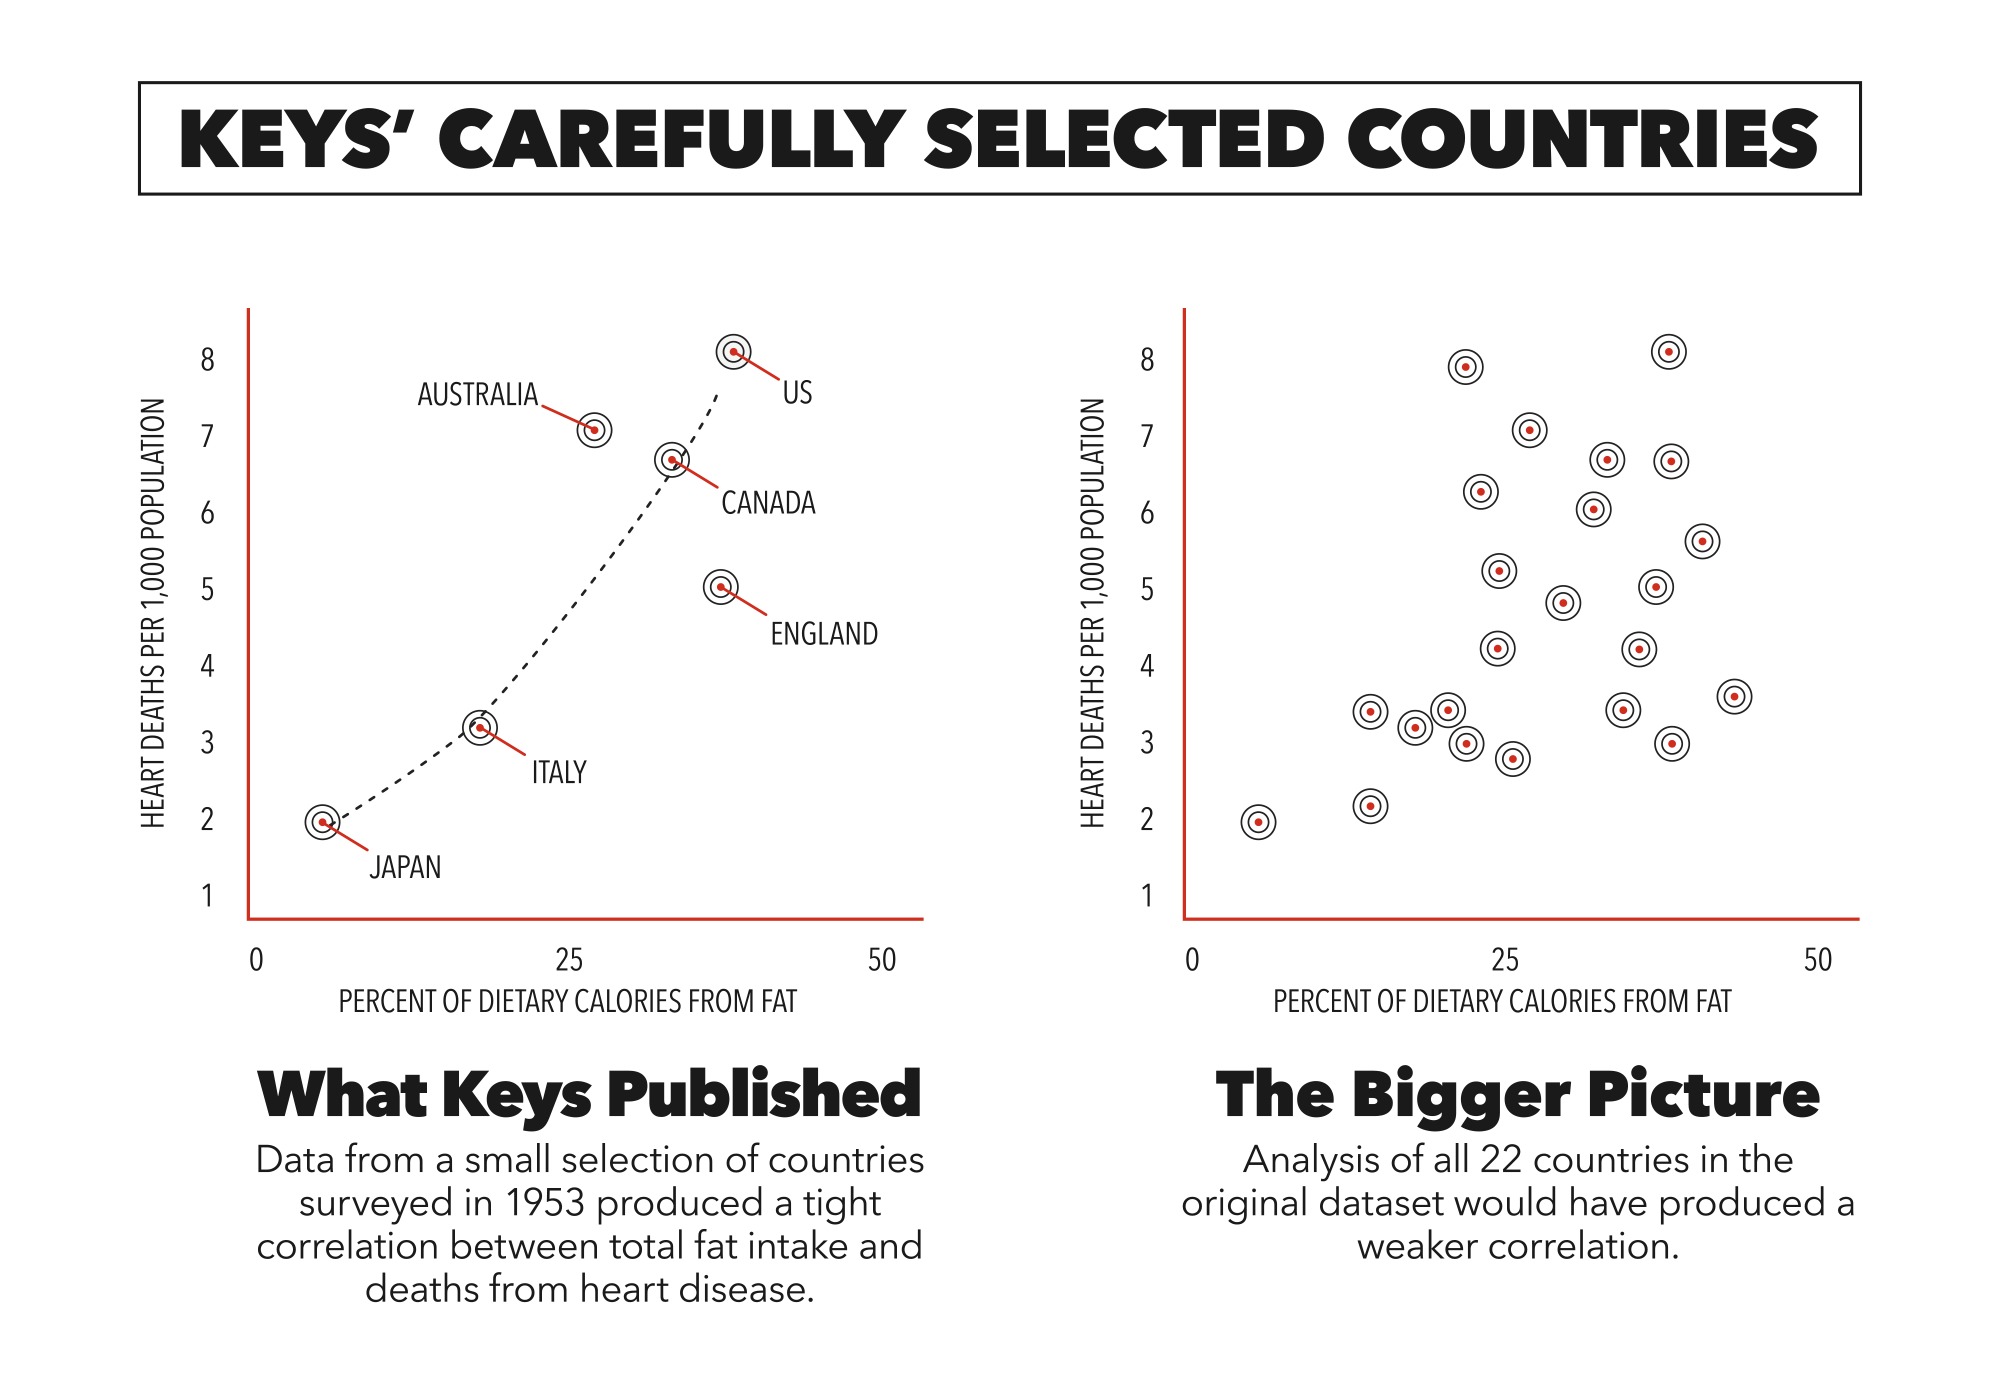
Figure 1: Graphing of all 22 countries shows a weaker correlation than what Keys presented. (CrossFit Inc.)
In his 1953 article “Atherosclerosis: A Problem in Newer Public Health,” Keys published a graph (Figure 2 below) linking fat-calorie availability in 1949 in six countries to deaths from coronary heart disease in middle-aged men. The graph seemed to demonstrate a striking, near-perfect correlation between fat intake and degenerative-heart-disease mortality, ranging from fewer than 1 in 1,000 deaths in the under-10-percent-fat-eating Japanese to over 7 in 1,000 deaths from the nearly 40 percent fat diets of Americans, with Italy, England and Wales, Australia, and Canada falling neatly along the curve between them (2).
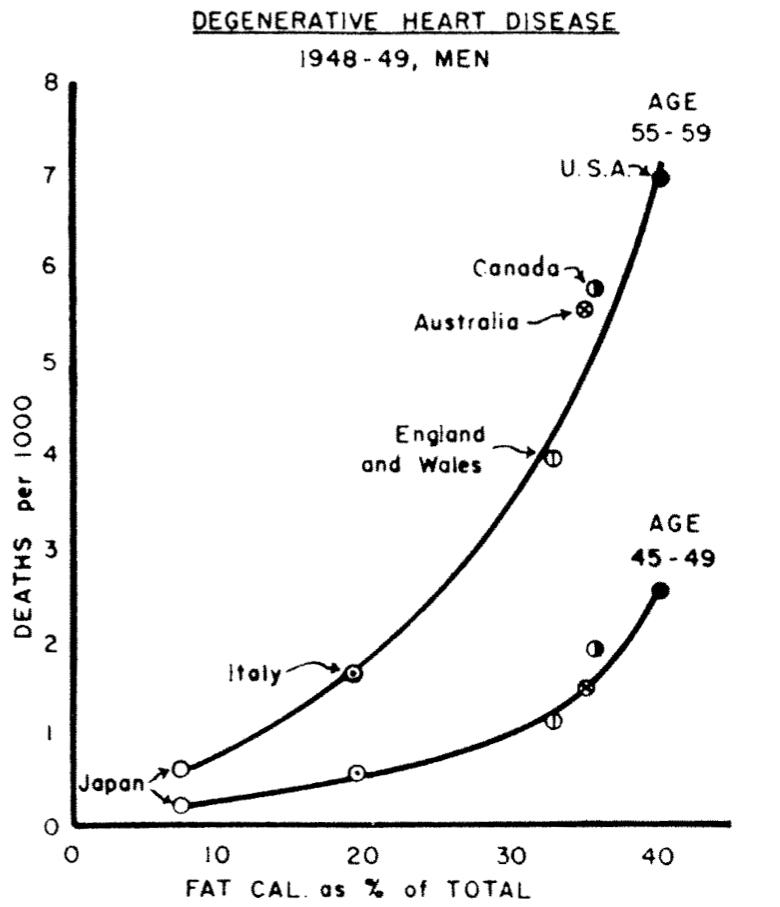
Figure 2: Keys’ 1953 graph, presented as follows: “Mortality from degenerative heart disease (categories 93 and 94 in the Revision of 1938, categories 420 and 422 in the Revision of 1948, International List. National vital statistics from official sources. Fat calories as percentage of total calories calculated from national food balance data for 1949 supplied by the Nutrition Division, Food and Agriculture Organization of the United Nations).”
The graph caused an international stir, thrusting Keys’ favored diet-heart hypothesis—that dietary fat increases cholesterol in the blood and elevated cholesterol causes heart disease, hence dietary fat causes heart disease—to the fore and launching its trajectory from hypothesis to “proven” fact, where it has persisted for half a century.
In “Fat in the Diet and Mortality From Heart Disease; A Methodologic Note,” Jacob Yerushalmy and Herman E. Hilleboe, both experienced statisticians in the public-health world, exposed the problems with Keys’ methodology and statistical analysis as well as his conclusion that the data supported a causative role for fat as the driver in the development of degenerative heart disease (3).
Based on the data expressed in the graph in his 1953 paper, Keys had speculated that “dietary fat somehow is associated with cardiac disease mortality at least in middle age.” By the time he got to the Conclusions section in the same paper, his speculation had strengthened to this: “The different age-specific death rates of men 40 to 65 from degenerative heart disease in different countries are directly related to the differences in those countries in the proportion of the total calories derived from total fats.”
While this bolder statement could be drawn from the data Keys presented for the six countries he selected for his graph, there were several methodological and analytical flaws, as Yerushalmy and Hilleboe pointed out in their 1957 rebuttal (and in a separate 1957 paper published by Hilleboe), beginning with the selection bias inherent in the data. This was the problem with Keys’ basing his selection on his exploratory research—the scientific equivalent of stacking the deck in a game of cards:
“In studies of association, as in any other study, the method of selecting data largely determines whether the results can safely be generalized. … Hence, it is of first importance to know on what basis the six countries were selected, in order to determine whether the findings for them can be generalized to other countries. Since no information is given by Keys on how or why the six countries were selected for (his graph), it is necessary to investigate the association between dietary fat and heart disease mortality in all countries for which information is available.”
If data of 12 countries had been included in the graphs, as shown below in Hilleboe’s figure, the case for an association (let alone a causative relationship) between dietary fat consumption and death from degenerative heart disease becomes less compelling (4).
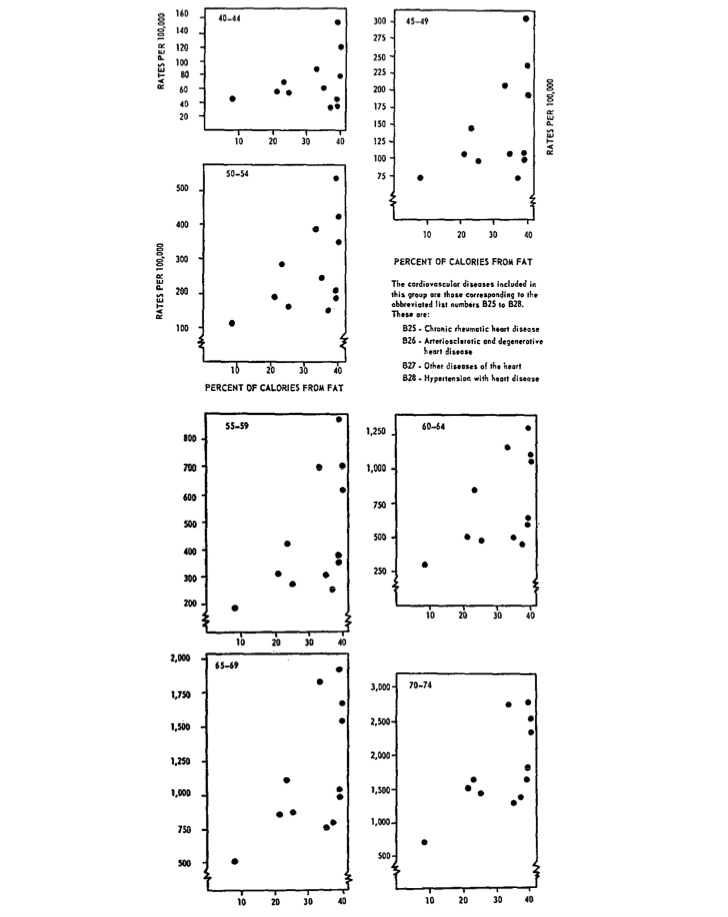
Figure 3: Hilleboe’s graphs, presented as follows: “Scatter diagrams of 12 countries according to percent of calories derived from fat and mortality from heart disease for males, by age.”
Yerushalmy and Hilleboe further noted that relevant information was available for 22 countries at that time and went on to describe the dangers of selective parsing of the data, such as the method employed by Keys:
“As an illustration of the importance of this question of selection, it may be of interest to show how by selection of countries it is possible to ‘demonstrate’ an apparent inverse relationship between percent of calories from fat and mortality from vascular lesions affecting the central nervous system (i.e., stroke).”
They used Figure 4 below to illustrate the point.
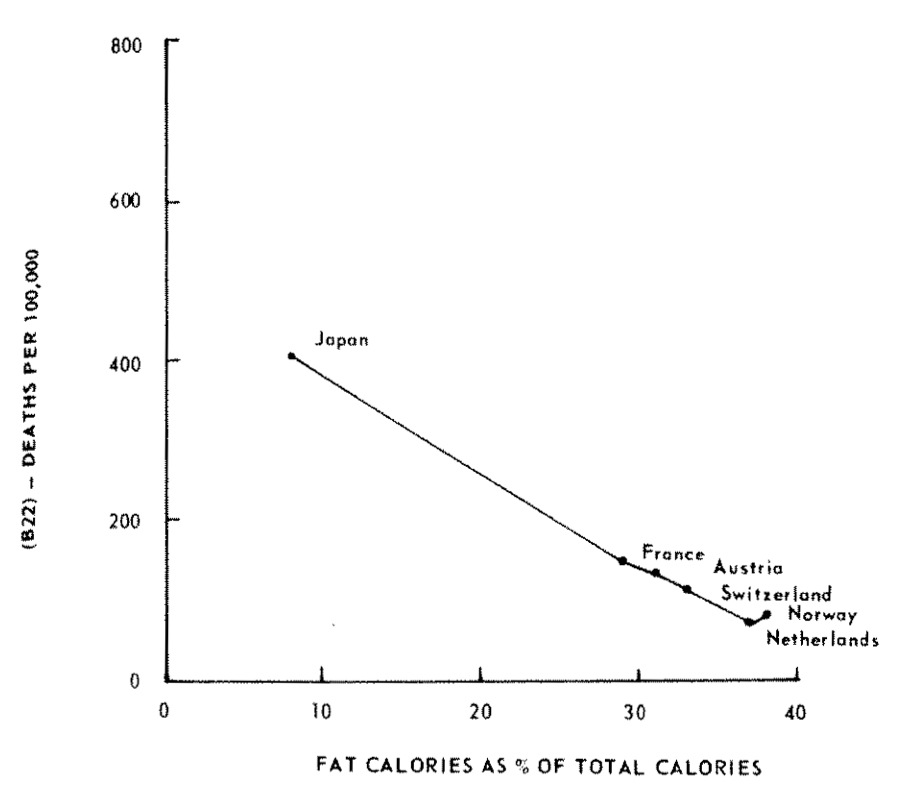
Figure 4: Yerushalmy and Hilleboe’s graph, presented as follows: “Mortality from vascular lesions affecting the central nervous system (B-22) and fat calories as per cent of total calories in males fifty-five to fifty-nine years from six countries selected for this specific purpose. Calculated from national food balance data by F.A.O. (Food and Agriculture Organization of the United Nations).”