“Studies show …” sounds an alarm that you are about to read exaggerated claims, questionable science, and only occasionally, real information. “Red meat causes diabetes,” “Eggs and cholesterol will make you sick,” and “low-carbohydrate diets will kill you.” Those of us trained in the physical sciences are astounded at the confusion and poor scientific logic that are rampant. At the same time, we are seeing major steps forward in nutritional medicine: Three recent papers show that, for many people, Type 2 diabetes can be cured with diet (1-3). And yet, the medical journals and popular media trumpet the most unreliable results. It’s pretty hard for scientists to penetrate some studies, and it is obviously worse for the end user: the person who simply wants to know what to eat. Oddly, there are warnings by many, including editors of the medical journals, that much of what is published — half is a common figure — is unreliable, unreproducible, and ultimately false (4). They don’t say which half. And mostly they don’t explain how they, the editors, the presumed gatekeepers, let this happen. It often seems that despite having more information now than in the past, you are pretty much on your own in deciding what is true and what is bogus.
The good news that makes things better than they once were is that you can often go back to the original scientific or medical paper and see for yourself. You really can be the judge. Good science is consistent with intuition, common sense, and basic honesty. Your intuition tells you that in a food supply with hundreds of different items, it is unlikely that something like eggs or red meat will, by itself, have a big impact on your susceptibility to disease or lifespan. A scientific study that says otherwise must have a very convincing argument and overwhelming data (which they never do). Also, while there is a nutritional medical establishment that is very reactionary and still maintains significant power, things are changing. There is, for instance, the increased availability of information on social media, including large numbers of meetings on alternative theories and methods (There’s a low-carbohydrate conference virtually every month). These, and the proliferation of scientific studies, make the old ways increasingly untenable. Here, the average end user finds allies among established professional scientists.
If you wish truly to be the judge, here are some guides to reading the nutritional medical literature:
- The burden is on the author of a scientific paper to make things clear. The goal of a scientific paper is to teach. There are complexities in science, but the job is to explain things in as straightforward a way as possible. Technical terms may have to be researched — many are only a Google away — but you should be sensitive to any attempt on the part of the authors to snow you.
- What scientists look for first in a paper are the pictures. I know it sounds funny, but in fact, figures are almost always better than tables. Whole books have been written about this idea. An experimental scientific paper that has no pictures should be viewed with suspicion.
- Observational studies, such as epidemiological studies, simply record outcomes. It is universally understood that observational studies can only show associations that are not necessarily causal in nature. The principle is frequently stated in papers that, nonetheless, then strongly suggest causality even as they offer the disclaimer. Such papers are obviously misleading, and it is important to attend to how much causality is implied. As described by The Rise and Fall of Modern Medicine (5), epidemiology “is constrained in its search for the causes of disease by only being able to measure that which is measurable in people’s lives. It cannot, by definition, discover hitherto unknown biological phenomena such as the new bacterium [at the time, in 1999,] helicobacter.” Modern biology advances most on mechanism. The author must explain the biology if it is not obvious. This is one of the criteria that has been established in science and courts of law.
- Be suspicious of arbitrary rules, “levels of evidence,” and “gold standards.” These are unknown in the physical and biological sciences, and there is nothing in medical research that changes that. The best experimental method is one that answers the scientific question. The Emperor of All Maladies (6) described the original observations on cigarette smoke and lung cancer. In the original cohort (cohort is the common term for a well-identified experimental group in a scientific study), there were 789 deaths, of which 36 were attributed to lung cancer. When the researchers asked how many of these were smokers, they found it was all 36. No statistics needed.
- Distinguish between statistical significance and biologic or clinical significance. If a scientific paper says, for example, that an association that was found between red meat and cancer is statistically significant, that only means that there is a very low probability that the association arose simply by chance. What it doesn’t say is that if you redid the analysis with another set of data testing the same parameters, you would get the same result. More important, “statistically significant” is a mathematical result. It does not tell you anything about biological or physical significance — that is, whether there is any reason for you to reduce red meat in order to avoid cancer. That comes only from experience and knowledge of the biology. If an experimental study shows you that a particular diet was associated with a statistically significant loss of 1 kilogram over several weeks, you know this is not meaningful, because you can lose a kilogram overnight. Statistics is a tool. Scientists are not cost accountants.
- It is frequently said that observational studies can only generate hypotheses. That is not right. They test hypotheses. They are not neutral. Single observations may generate a hypothesis, but observational studies constitute an attempt to support that hypothesis. If you study the association between fat and cardiovascular disease, you have something in mind, and you suspect that fat is the cause. If the association is weak, you have to reject your hypothesis.
- Excluding theories is more important than showing consistency. Consistency must always be tested against. Of course, a theory can only truly be excluded if it is mathematically excluded or leads to a logical contradiction. On the other hand, while an association is not necessarily linked to causality, a lack of association is an argument for a lack of causality.
- Note: Before considering further details, some points on language are important. The numbers in nutritional epidemiology are expected to show an association between some food or dietary practice and a medical outcome. This outcome is usually presented as odds ratio (OR), relative risk (RR), or hazard ratio (HR), which compare the effect of, say, high red meat consumption versus low red meat consumption on risk of cancer. These quantities are obviously relative statistics. They are mathematically somewhat different, but for the cases of interest here (generally low incidence of disease), they can be taken as equivalent. From the name, you can see that they are relative values and have the limitation of obscuring absolute values. “Risk” in statistics means probability. (It is important not to confuse this with the commonly used meaning of susceptibility to poor outcome. Statistically, risk may refer to the probability of getting better.) Probability is, by analogy with betting, the number of ways of winning divided by all the possible outcomes.
- Considering all the caveats above, how do you tell when epidemiological or observational studies can be taken to support causality? In answering that question, the standard is the criteria proposed by Bradford Hill, who performed the original work on cigarette smoke and lung cancer. Hill was clear that there were not formal rules but rather reasonable ideas that derive from common sense and shared experience. There are several discussions of Hill’s rules (7), and not all will apply to every case, but the most important is the one that Hill considered as first: the strength of the association. Hill’s own work on cancer showed, “The death rate from cancer of the lung in cigarette smokers is nine to ten times the rate in non-smokers and the rate in heavy cigarette smokers is twenty to thirty times as great.” Hill was concerned that even a ratio of 2-to-1 for smokers vs. nonsmokers for incidence of heart disease was marginally reliable. It is a rare paper in the epidemiological literature that even gets close to 2-to-1. Odds of 2-to-1 are usually a minimum in a court of law to introduce epidemiological data into evidence. The persistent acceptance of low relative-risk values actually leaves almost all of nutritional epidemiology open to question.
- Sometimes it’s easier to visualize odds ratios by converting to a rough estimate of odds. A simple way to do that is to add 1 to the odds ratio and take the reciprocal. For example, if the odds ratio is 1.5, add 1 to get 2.5 and the reciprocal is 0.4, which is the lower odds; that is, 1.5 is the same as 60-to-40 – or close to even – odds. Ask yourself how much you would change your lifestyle for 60-to-40 odds.
- Is there evidence of bias? Are value judgments stated as fact? “Healthy,” and “evidence-based” are value judgments, and it is for the reader, not the author, to decide. Even one of those can turn a scientific paper into an infomercial. In the Rashmi Sinha paper discussed below, the categories of red meat are referred to as “high-, medium-, and low-risk meat diet.” This is obviously trying to manipulate the readers. That’s not kosher.
- The basic idea of most of the recommendations here is to be critical and skeptical of the paper you’re reading. There are, however, criticisms that are not relevant. You must assume that the data are reported honestly — falsification is very serious and cannot be considered without clear evidence. You can be very critical of the authors’ analysis, but you must assume that the data are as they say.
An example
To demonstrate some of the 12 points, I will review a study that I discussed in Nutrition in Crisis (4). Sinha, et al. (8) was one of several studies that claim to have found that red meat consumption is a risk for cancer or other disease states, or that, in fact, high consumption of red meat increases chance of death by any cause. In this study, there were two cohorts of 322,263 men and 223,390 women. The subjects were given a questionnaire on their lifestyle and eating habits, and their consumption of red meat and white meat was determined. Sinha, et al. broke the cohorts into five groups (quintiles), each according to the amount of red meat consumed, keeping as many other parameters as possible constant across quintiles. (Different studies might use tertiles, quartiles, etc. The generic term is quantile.) Let’s look at the risk for death from cancer. That’s supposed to be the big risk with red meat. So what did Sinha, et al. discover?
First, there are no pictures. A little discouraging. There are several mind-numbing tables with much data. An excerpt of Table 2 from the paper is shown in Figure 1.
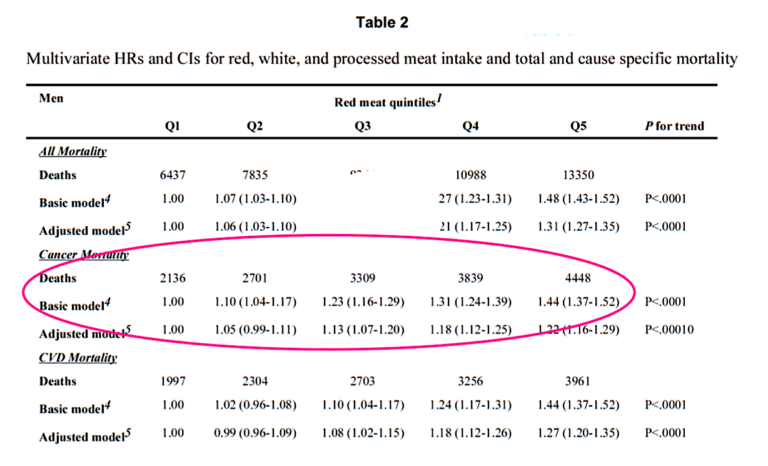
Figure 1: Hazard ratios (HR) for mortality associated with red meat consumption. Excerpt of Table 2 from Sinha, et al. (9).
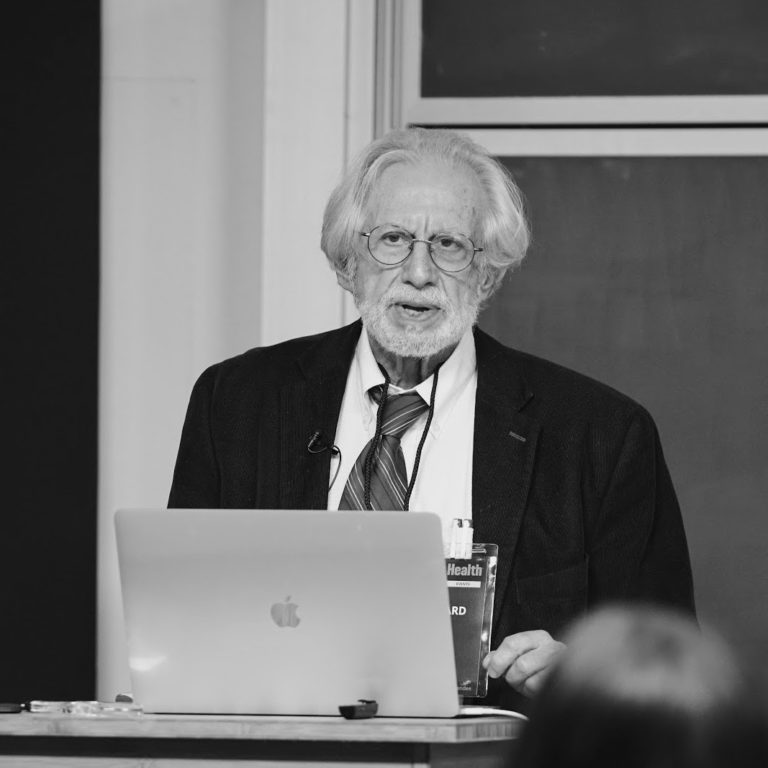 Richard David Feinman, Ph.D., is a professor of cell biology at the State University of New York Downstate Medical Center in Brooklyn, where he has been a pioneer in incorporating nutrition into the biochemistry curriculum. A graduate of the University of Rochester and the University of Oregon, Dr. Fein